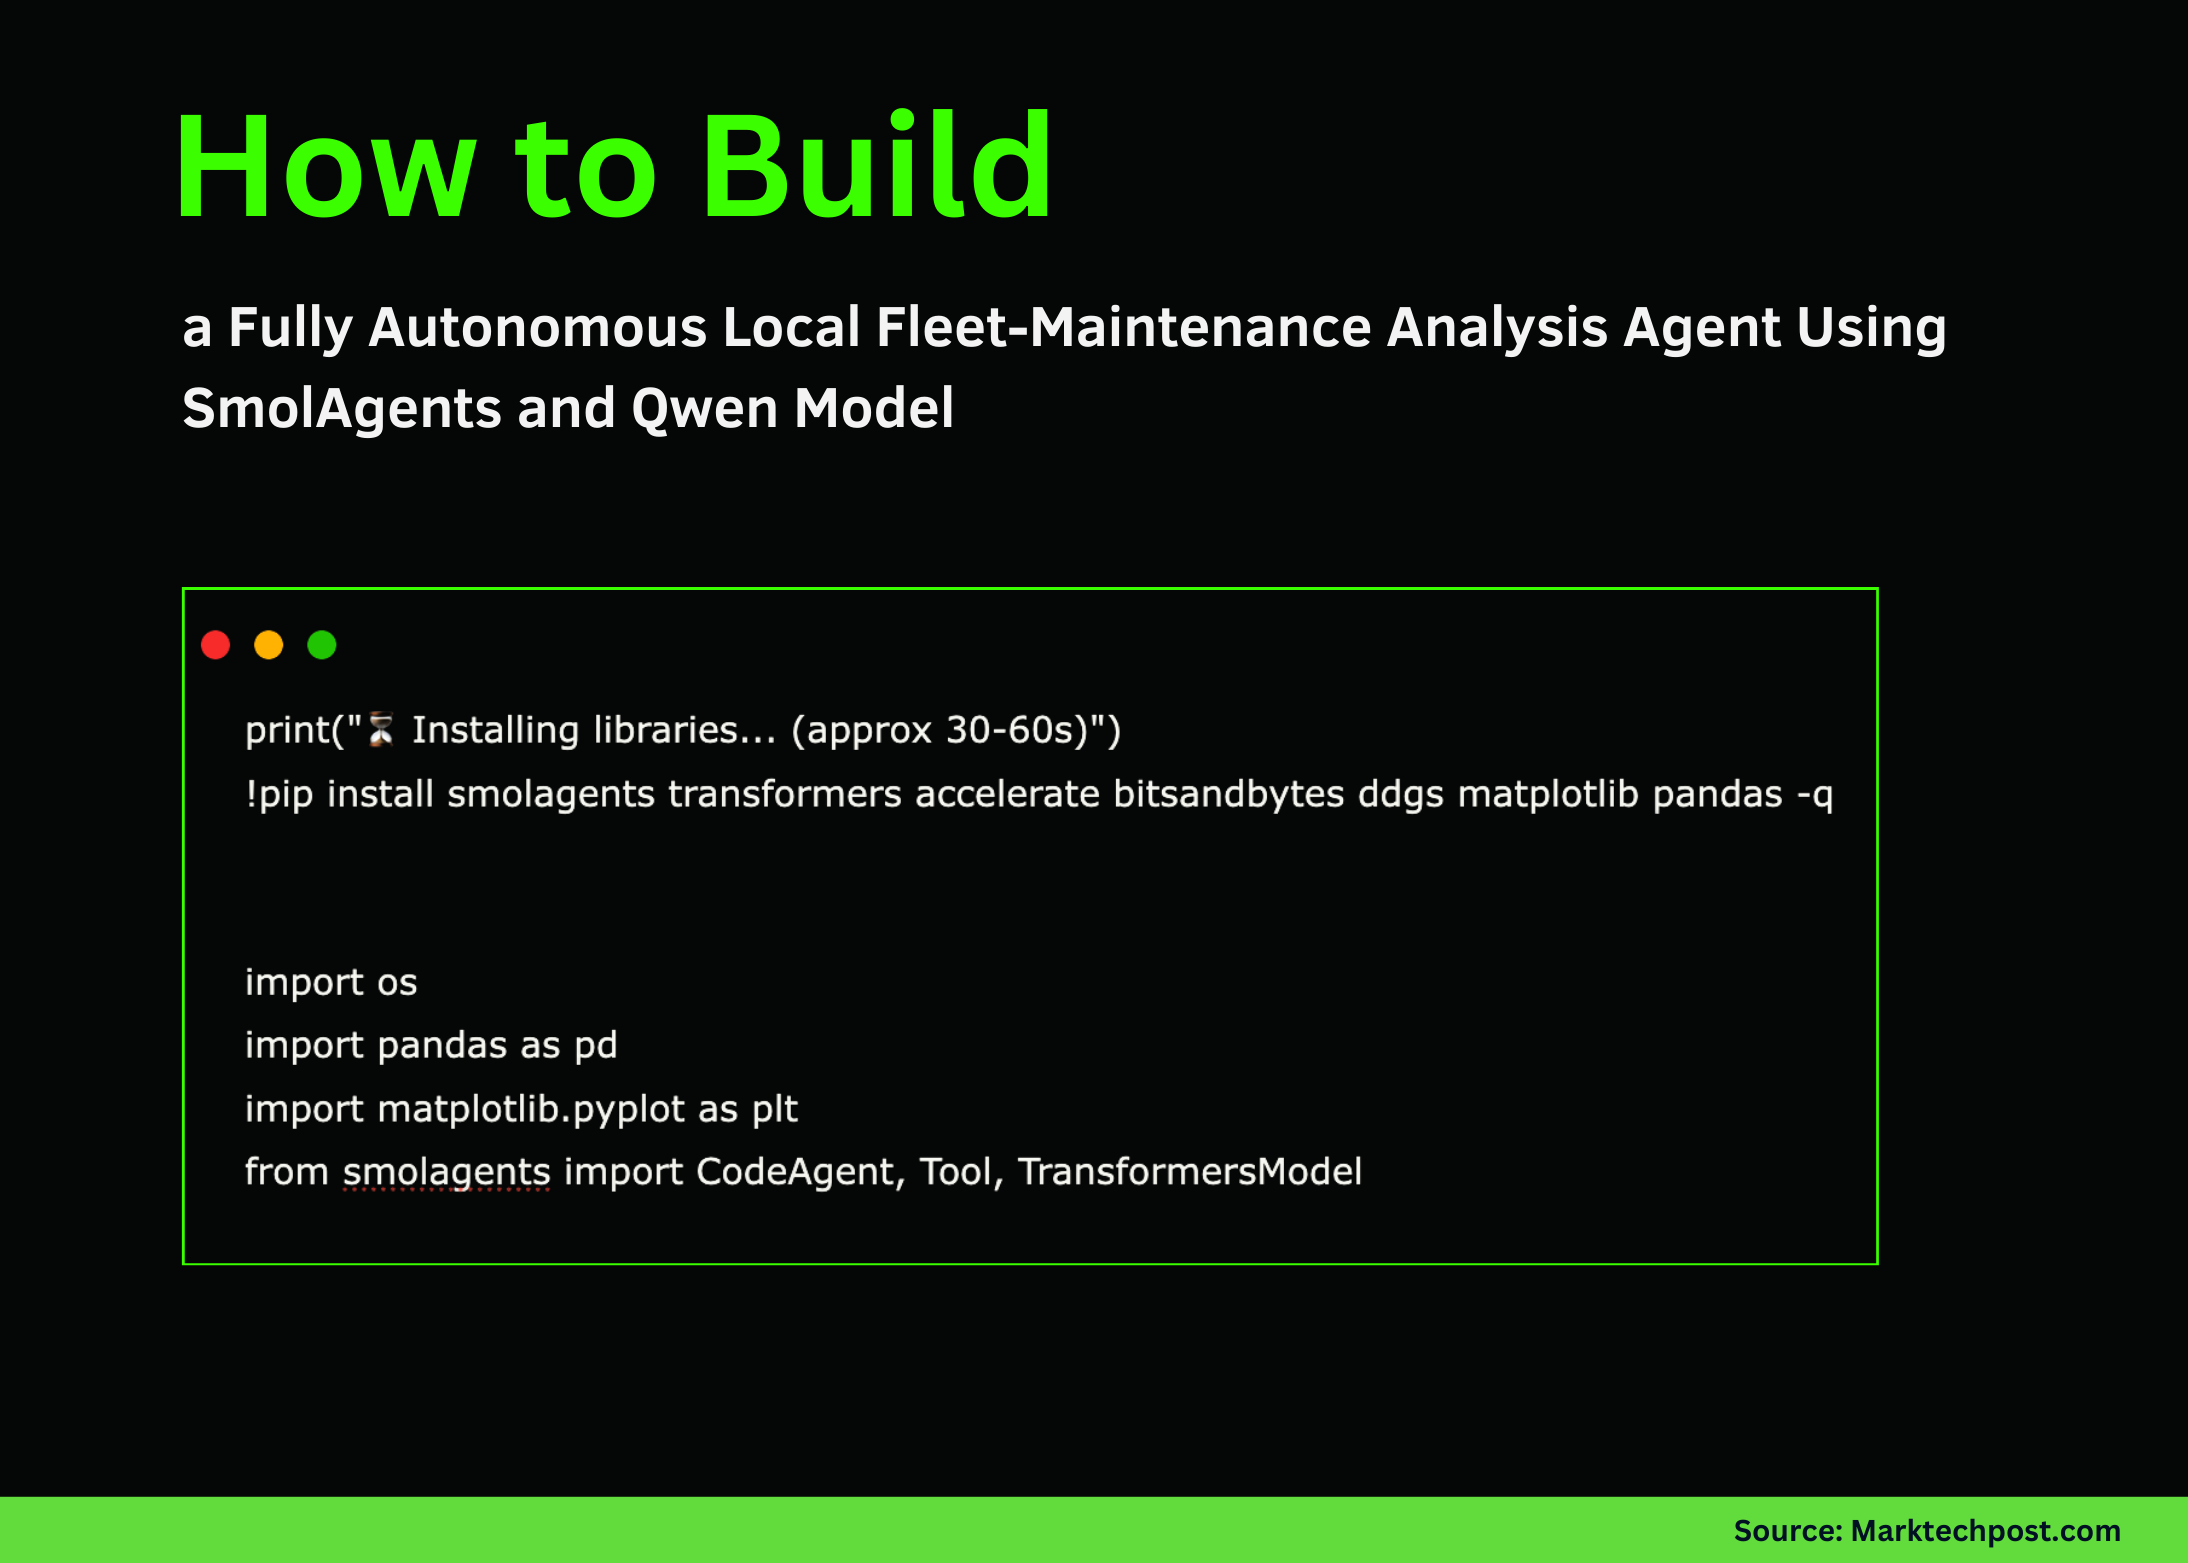
In this tutorial, we walk through the process of creating a fully autonomous fleet-analysis agent using SmolAgents and a local Qwen model. We generate telemetry data, load it through a custom tool, and let our agent reason, analyze, and visualize maintenance risks without any external API calls. At each step of implementation, we see how the agent interprets structured logs, applies logical filters, detects anomalies, and finally produces a clear visual warning for fleet managers. Check out the FULL CODES here.
print("⏳ Installing libraries... (approx 30-60s)") !pip install smolagents transformers accelerate bitsandbytes ddgs matplotlib pandas -q import os import pandas as pd import matplotlib.pyplot as plt from smolagents import CodeAgent, Tool, TransformersModelWe install all required libraries and import the core modules we rely on for building our agent. We set up SmolAgents, Transformers, and basic data-handling tools to process telemetry and run the local model smoothly. At this stage, we prepare our environment and ensure everything loads correctly before moving ahead. Check out the FULL CODES here.
fleet_data = { "truck_id": ["T-101", "T-102", "T-103", "T-104", "T-105"], "driver": ["Ali", "Sara", "Mike", "Omar", "Jen"], "avg_speed_kmh": [65, 70, 62, 85, 60], "fuel_efficiency_kml": [3.2, 3.1, 3.3, 1.8, 3.4], "engine_temp_c": [85, 88, 86, 105, 84], "last_maintenance_days": [30, 45, 120, 200, 15] } df = pd.DataFrame(fleet_data) df.to_csv("fleet_logs.csv", index=False) print("✅ 'fleet_logs.csv' created.")We generate the dummy fleet dataset that our agent will later analyze. We create a small but realistic set of telemetry fields, convert it into a DataFrame, and save it as a CSV file. Here, we establish the core data source that drives the agent’s reasoning and predictions. Check out the FULL CODES here.
class FleetDataTool(Tool): name = "load_fleet_logs" description = "Loads vehicle telemetry logs from 'fleet_logs.csv'. Returns the data summary." inputs = {} output_type = "string" def forward(self): try: df = pd.read_csv("fleet_logs.csv") return f"Columns: {list(df.columns)}nData Sample:n{df.to_string()}" except Exception as e: return f"Error loading logs: {e}"We define the FleetDataTool, which acts as the bridge between the agent and the underlying telemetry file. We give the agent the ability to load and inspect the CSV file to understand its structure. This tool becomes the foundation for every subsequent analysis the model performs. Check out the FULL CODES here.
print("⏳ Downloading & Loading Local Model (approx 60-90s)...") model = TransformersModel( model_id="Qwen/Qwen2.5-Coder-1.5B-Instruct", device_map="auto", max_new_tokens=2048 ) print("✅ Model loaded on GPU.") agent = CodeAgent( tools=[FleetDataTool()], model=model, add_base_tools=True ) print("n🤖 Agent is analyzing fleet data... (Check the 'Agent' output below)n") query = """ 1. Load the fleet logs. 2. Find the truck with the worst fuel efficiency (lowest 'fuel_efficiency_kml'). 3. For that truck, check if it is overdue for maintenance (threshold is 90 days). 4. Create a bar chart comparing the 'fuel_efficiency_kml' of ALL trucks. 5. Highlight the worst truck in RED and others in GRAY on the chart. 6. Save the chart as 'maintenance_alert.png'. """ response = agent.run(query) print(f"n📝 FINAL REPORT: {response}")We load the Qwen2.5 local model and initialize our CodeAgent with the custom tool. We then craft a detailed query outlining the reasoning steps we want the agent to follow and execute it end-to-end. This is where we watch the agent think, analyze, compute, and even plot, fully autonomously. Check out the FULL CODES here.
if os.path.exists("maintenance_alert.png"): print("n📊 Displaying Generated Chart:") img = plt.imread("maintenance_alert.png") plt.figure(figsize=(10, 5)) plt.imshow(img) plt.axis('off') plt.show() else: print("⚠️ No chart image found. Check the agent logs above.")We check whether the agent successfully saved the generated maintenance chart and display it if available. We visualize the output directly in the notebook, allowing us to confirm that the agent correctly performed data analysis and plotting. This gives us a clean, interpretable result from the entire workflow.
In conclusion, we built an intelligent end-to-end pipeline that enables a local model to autonomously load data, evaluate fleet health, identify the highest-risk vehicle, and generate a diagnostic chart for actionable insights. We witness how easily we can extend this framework to real-world datasets, integrate more complex tools, or add multi-step reasoning capabilities for safety, efficiency, or predictive maintenance use cases. At last, we appreciate how SmolAgents empowers us to create practical agentic systems that execute real code, reason over real telemetry, and deliver insights immediately.
Check out the FULL CODES here. Also, feel free to follow us on Twitter and don’t forget to join our 100k+ ML SubReddit and Subscribe to our Newsletter. Wait! are you on telegram? now you can join us on telegram as well.

Michal Sutter
Michal Sutter is a data science professional with a Master of Science in Data Science from the University of Padova. With a solid foundation in statistical analysis, machine learning, and data engineering, Michal excels at transforming complex datasets into actionable insights.