
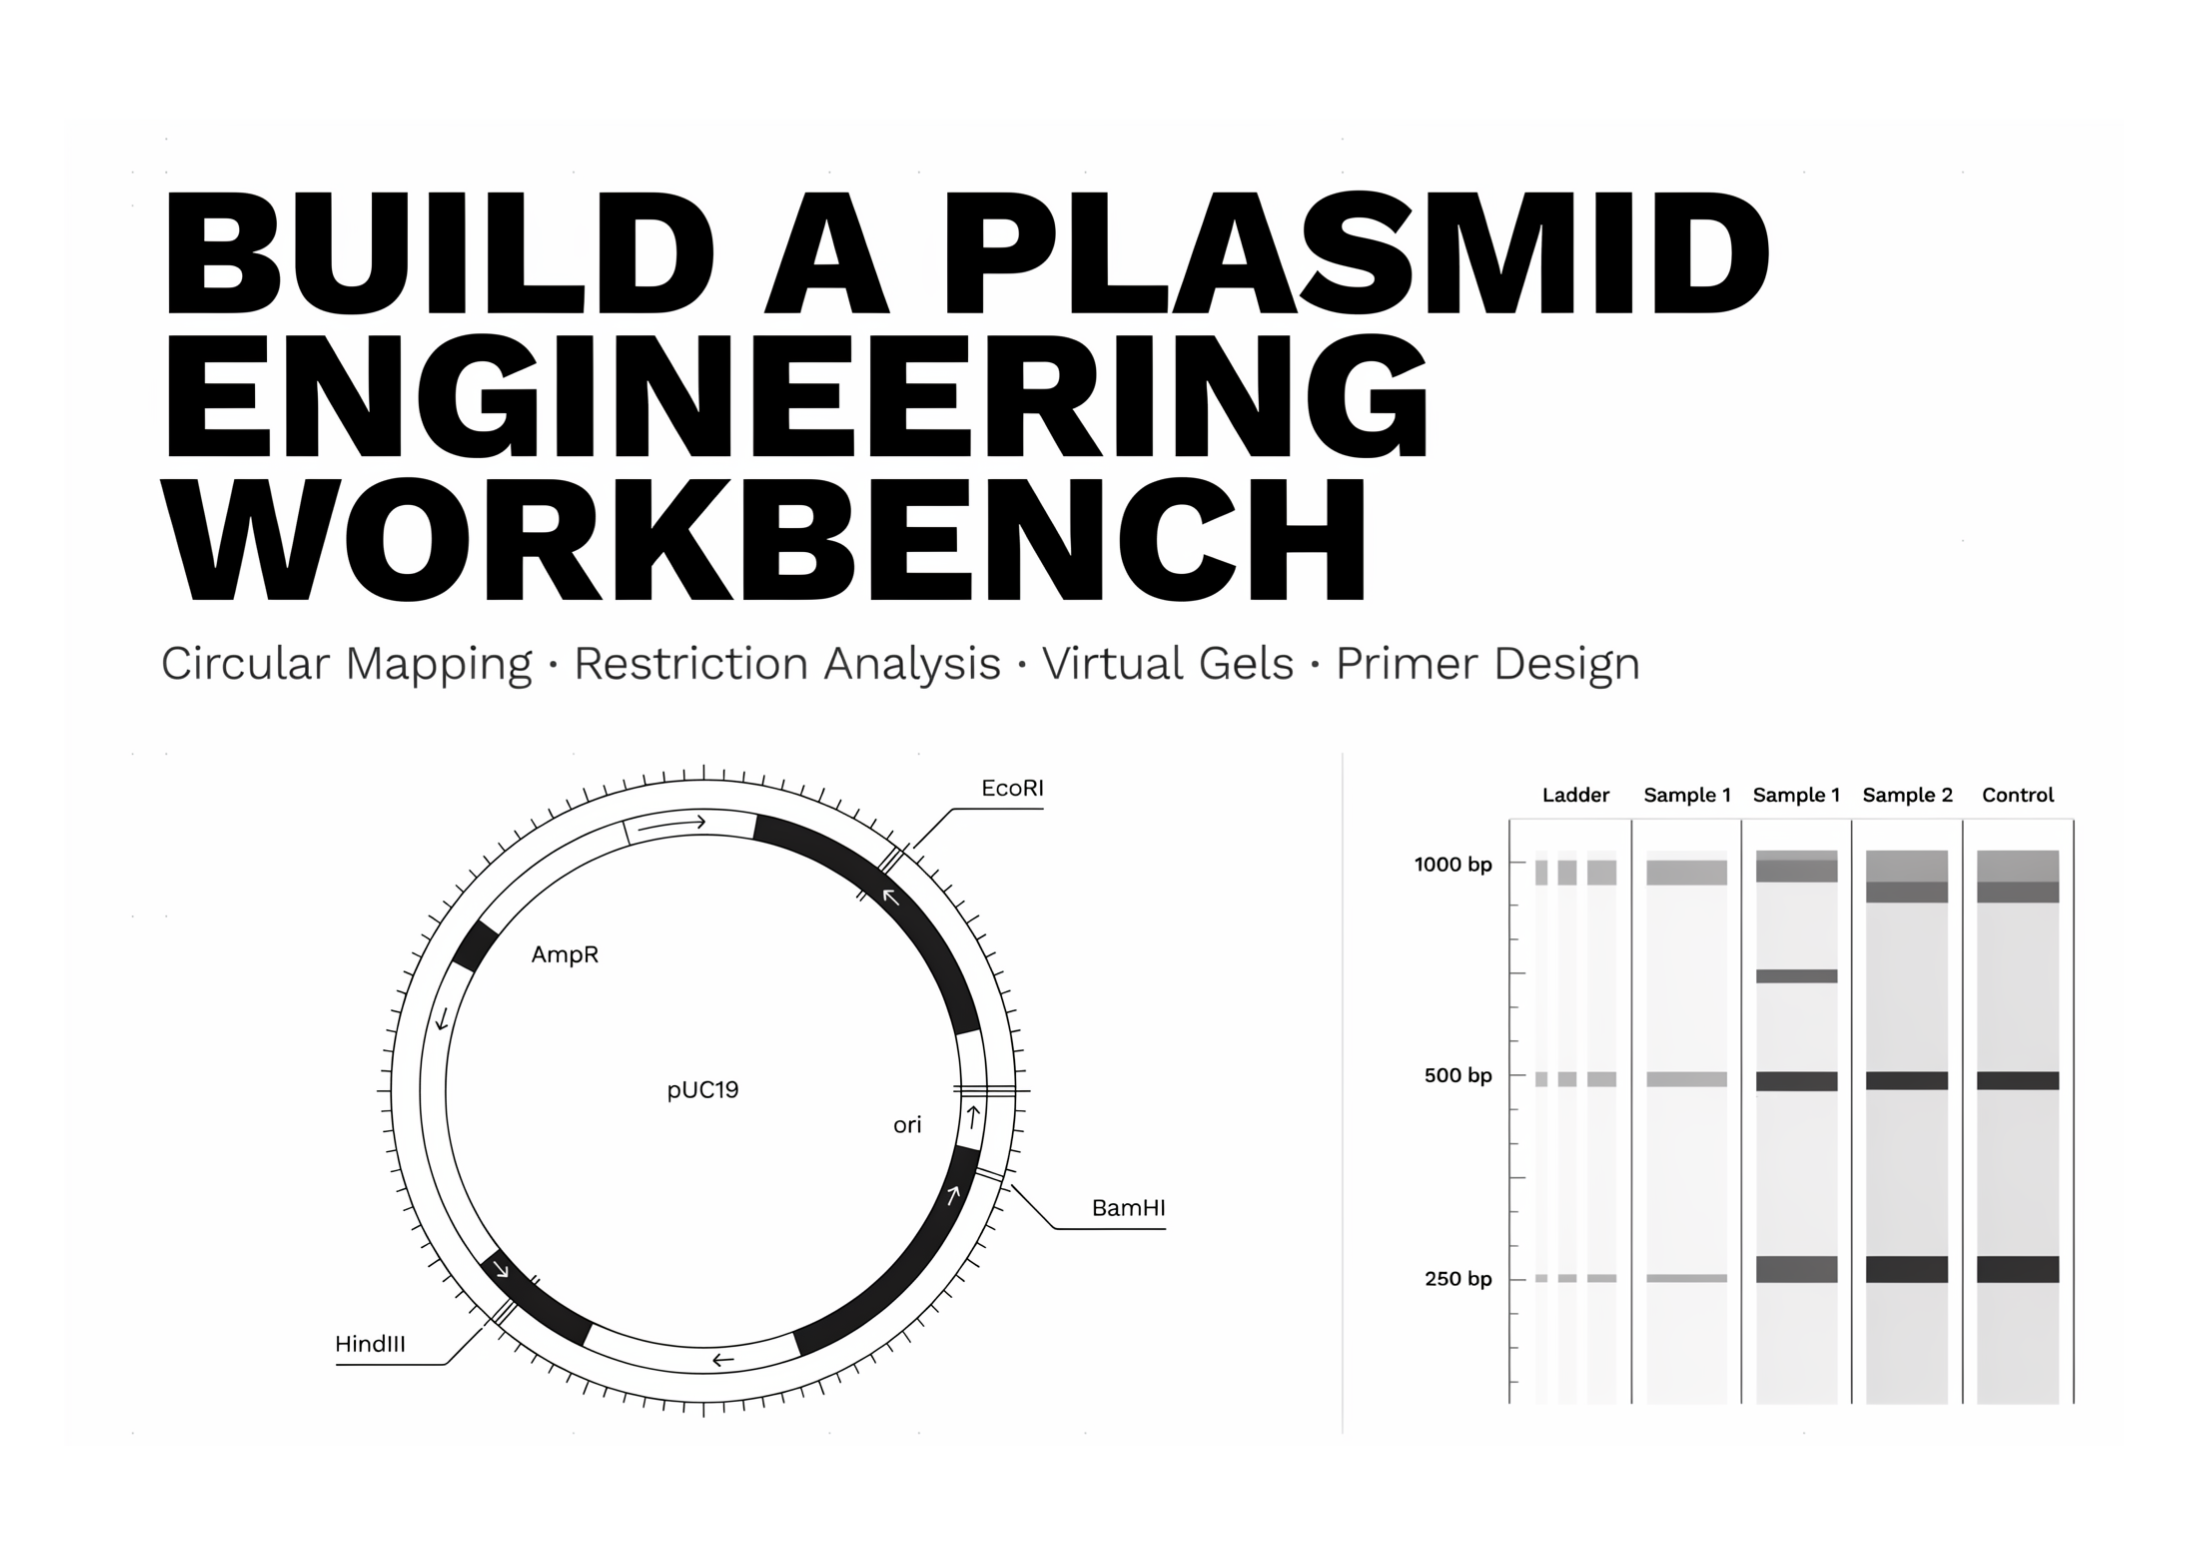
In this tutorial, we build a Google Colab-native plasmid workbench that recreates the core ideas of SpliceCraft inside an interactive notebook environment. Instead of relying on a terminal-based TUI, we use Biopython, NumPy, and Matplotlib to load plasmid records, normalize annotated genomic features, render circular and linear plasmid maps, compute sequence statistics, analyze restriction enzyme cut sites, simulate virtual digests, scan open reading frames, translate CDS features, design primers, and apply sequence edits programmatically. We begin with a synthetic offline plasmid so the workflow runs reliably without external dependencies, while still supporting optional NCBI GenBank fetching and local GenBank uploads.
try: import Bio except ImportError: import subprocess, sys subprocess.run([sys.executable, "-m", "pip", "install", "-q", "biopython"], check=True) import math, io, textwrap, random import numpy as np import matplotlib import matplotlib.pyplot as plt from matplotlib.patches import Polygon from Bio import Entrez, SeqIO from Bio.Seq import Seq from Bio.SeqRecord import SeqRecord from Bio.SeqFeature import SeqFeature, FeatureLocation from Bio.Restriction import RestrictionBatch, Analysis, CommOnly try: from Bio.SeqUtils import MeltingTemp as _mt except Exception: _mt = None EMAIL = "[email protected]" ACCESSION = "L09137" USE_NCBI = False Entrez.email = EMAIL TYPE_COLORS = { "CDS": "#d1495b", "gene": "#c1666b", "rep_origin": "#2e86ab", "promoter": "#e3a008", "terminator": "#8d99ae", "misc_feature": "#6a994e", "primer_bind": "#9d4edd", "protein_bind": "#457b9d", "source": "#adb5bd", } def _color(ftype): return TYPE_COLORS.get(ftype, "#6a994e") MCS = "GAATTCGAGCTCGGTACCCGGGGATCCTCTAGAGTCGACCTGCAGGCATGCAAGCTT" def _synthetic_plasmid(): random.seed(19) body = "".join(random.choice("ACGT") for _ in range(2686)) seq = body[:400] + MCS + body[400:] rec = SeqRecord(Seq(seq), id="pDEMO", name="pDEMO", description="Synthetic offline demo plasmid (SpliceCraft-Colab)") rec.annotations["topology"] = "circular" rec.annotations["molecule_type"] = "ds-DNA" def feat(s, e, strand, ftype, label): f = SeqFeature(FeatureLocation(s, e, strand=strand), type=ftype) f.qualifiers["label"] = [label]; return f rec.features += [ feat(400, 400 + len(MCS), 1, "misc_feature", "MCS"), feat(700, 1561, 1, "CDS", "AmpR"), feat(1700, 2260, -1, "rep_origin", "ori"), feat(2350, 2686, 1, "CDS", "lacZ-alpha"), ] rec.features[1].qualifiers["product"] = ["beta-lactamase (demo)"] return rec def load_record(): if USE_NCBI and "@" in EMAIL and not EMAIL.startswith("you@"): try: h = Entrez.efetch(db="nucleotide", id=ACCESSION, rettype="gbwithparts", retmode="text") rec = SeqIO.read(h, "genbank"); h.close() print(f"✓ Fetched {ACCESSION} from NCBI: {rec.description}") return rec except Exception as e: print(f"⚠ NCBI fetch failed ({e}); using synthetic demo plasmid.") else: print("ℹ USE_NCBI is off (or EMAIL not set) — using synthetic demo plasmid.") return _synthetic_plasmid() def upload_gb(): from google.colab import files up = files.upload() name = next(iter(up)) return SeqIO.read(io.StringIO(up[name].decode()), "genbank") def label_of(f): for k in ("label", "gene", "product", "note"): if k in f.qualifiers: return f.qualifiers[k][0] return f.type def norm_features(rec, skip_source=True, min_len=0): L = len(rec.seq); out = [] for f in rec.features: if skip_source and f.type in ("source",): continue s = int(f.location.start); e = int(f.location.end) if (e - s) < min_len: continue out.append(dict(start=s % L, end=e % L, strand=f.location.strand or 1, type=f.type, label=label_of(f), color=_color(f.type))) return out We set up the notebook environment, install Biopython when needed, and import the scientific, plotting, and sequence-analysis libraries required for the workflow. We define the plasmid configuration, feature color palette, multiple cloning site, and fallback synthetic plasmid so the tutorial works even without an internet connection. We also create helper functions to load records from NCBI or GenBank files and normalize annotated sequence features into drawable metadata.
def _ang(bp, L): return math.pi/2 - 2*math.pi*(bp/L) def _pt(bp, r, L): a = _ang(bp, L); return r*math.cos(a), r*math.sin(a) def _arc(s, e, r, L, n=240): if e < s: e += L bps = np.linspace(s, e, max(2, int(n*(e-s)/L)+2)) return ([r*math.cos(_ang(b, L)) for b in bps], [r*math.sin(_ang(b, L)) for b in bps]) def gc_percent(seq): s = str(seq).upper(); n = len(s) or 1 return 100.0 * (s.count("G") + s.count("C")) / n def circular_map(rec, title=None, show_gc=True): L = len(rec.seq); feats = norm_features(rec) fig, ax = plt.subplots(figsize=(8, 8)); R = 1.0 if show_gc: w = max(30, L // 120); step = max(1, w // 2); mean = gc_percent(rec.seq) s = str(rec.seq).upper() for i in range(0, L, step): win = s[i:i+w] or s[i:] + s[:(i+w) % L] dev = (gc_percent(win) - mean) / 100.0 rr = 0.72 + dev * 0.9 x0, y0 = _pt(i, 0.72, L); x1, y1 = _pt(i, rr, L) ax.plot([x0, x1], [y0, y1], color="#2e86ab" if dev >= 0 else "#d1495b", lw=1, alpha=0.5, zorder=1) xs, ys = _arc(0, L, R, L); ax.plot(xs, ys, color="#333", lw=2.5, zorder=2) step = max(1, round(L/12/100)*100) or max(1, L//12) for t in range(0, L, step): x0, y0 = _pt(t, R*1.015, L); x1, y1 = _pt(t, R*1.045, L) ax.plot([x0, x1], [y0, y1], color="#999", lw=1, zorder=2) lx, ly = _pt(t, R*1.10, L) ax.text(lx, ly, f"{t:,}", ha="center", va="center", fontsize=7, color="#777") for f in feats: outer = f["strand"] >= 0 rr = R + 0.09 if outer else R - 0.09 xs, ys = _arc(f["start"], f["end"], rr, L) ax.plot(xs, ys, color=f["color"], lw=10, solid_capstyle="butt", alpha=0.9, zorder=3) tip = f["end"] if outer else f["start"] a = _ang(tip, L); tx, ty = rr*math.cos(a), rr*math.sin(a) d = -1 if outer else 1 tanx, tany = -math.sin(a)*d, math.cos(a)*d px, py = math.cos(a), math.sin(a) ln, wd = 0.055, 0.052 ax.add_patch(Polygon([(tx+tanx*ln, ty+tany*ln), (tx+px*wd, ty+py*wd), (tx-px*wd, ty-py*wd)], color=f["color"], zorder=4)) span = (f["end"] - f["start"]) % L mid = (f["start"] + span/2) % L lx, ly = _pt(mid, (rr + 0.16) if outer else (rr - 0.16), L) ax.text(lx, ly, f["label"], ha="center", va="center", fontsize=8.5, color=f["color"], weight="bold", zorder=5) circ = "circular" if rec.annotations.get("topology") == "circular" else "linear" ax.text(0, 0.05, title or rec.name, ha="center", va="center", fontsize=15, weight="bold") ax.text(0, -0.07, f"{L:,} bp · {gc_percent(rec.seq):.1f}% GC · {circ}", ha="center", va="center", fontsize=9.5, color="#555") ax.set_xlim(-1.45, 1.45); ax.set_ylim(-1.45, 1.45) ax.set_aspect("equal"); ax.axis("off"); plt.tight_layout(); plt.show() We implement the circular plasmid visualization by mapping base-pair positions to angular coordinates on a clockwise ring. We calculate GC content, draw the plasmid backbone, add tick marks, render feature arcs, and attach directional arrowheads to clearly indicate strand orientation. We also add labels and central sequence metadata so that the map is both biologically informative and visually readable in Colab.
def linear_map(rec): L = len(rec.seq); feats = norm_features(rec) fig, ax = plt.subplots(figsize=(11, 2.6)) ax.hlines(0, 0, L, color="#333", lw=2) for f in feats: y = 0.35 if f["strand"] >= 0 else -0.35 s, e = f["start"], f["end"] segs = [(s, e)] if e >= s else [(s, L), (0, e)] for a, b in segs: ax.annotate("", xy=(b if f["strand"] >= 0 else a, y), xytext=(a if f["strand"] >= 0 else b, y), arrowprops=dict(arrowstyle="-|>", color=f["color"], lw=7, alpha=0.85)) ax.text((s + ((e - s) % L)/2) % L, y + (0.28 if y > 0 else -0.28), f["label"], ha="center", va="center", fontsize=8.5, color=f["color"], weight="bold") ax.set_xlim(-L*0.02, L*1.02); ax.set_ylim(-1, 1) ax.set_yticks([]); ax.set_xlabel("position (bp)") ax.set_title(f"{rec.name} — linear view", fontsize=11) for sp in ("top", "left", "right"): ax.spines[sp].set_visible(False) plt.tight_layout(); plt.show() def gc_skew_plot(rec, window=None): s = str(rec.seq).upper(); L = len(s) window = window or max(50, L // 100); skew = []; run = 0 for i in range(0, L, window): w = s[i:i+window]; g, c = w.count("G"), w.count("C") run += (g - c) / max(1, g + c); skew.append(run) fig, ax = plt.subplots(figsize=(11, 2.6)) ax.plot(np.arange(len(skew))*window, skew, color="#2e86ab") ax.axhline(0, color="#aaa", lw=0.8) ax.set_title(f"Cumulative GC-skew — {rec.name} (min≈replication origin, max≈terminus)", fontsize=10) ax.set_xlabel("position (bp)"); ax.set_ylabel("cumulative skew") plt.tight_layout(); plt.show() def stats(rec): seq = str(rec.seq).upper(); L = len(seq) print(f"── {rec.name} ─────────────────────────────") print(f"length : {L:,} bp") print(f"GC content : {gc_percent(seq):.2f} %") print(f"A/T/G/C : {seq.count('A')}/{seq.count('T')}/{seq.count('G')}/{seq.count('C')}") print(f"topology : {rec.annotations.get('topology', 'unknown')}") print(f"features : {len(norm_features(rec))} annotated") def _is_circular(rec): return rec.annotations.get("topology") == "circular" def find_sites(rec, enzymes=None): batch = RestrictionBatch(enzymes) if enzymes else CommOnly ana = Analysis(batch, rec.seq, linear=not _is_circular(rec)) return {str(k): v for k, v in ana.full().items()} def unique_cutters(rec, enzymes=None): hits = find_sites(rec, enzymes) return sorted([e for e, pos in hits.items() if len(pos) == 1]) def digest_fragments(rec, enzymes): hits = find_sites(rec, enzymes) cuts = sorted({p for pos in hits.values() for p in pos}) L = len(rec.seq) if not cuts: return [L] if _is_circular(rec): frags = [cuts[i+1] - cuts[i] for i in range(len(cuts)-1)] frags.append(L - cuts[-1] + cuts[0]) else: frags = [cuts[0]] + [cuts[i+1]-cuts[i] for i in range(len(cuts)-1)] + [L - cuts[-1]] return sorted((f for f in frags if f > 0), reverse=True) def restriction_report(rec, enzymes=None): hits = find_sites(rec, enzymes) cutting = {e: p for e, p in hits.items() if p} print(f"── Restriction map of {rec.name} " f"({'circular' if _is_circular(rec) else 'linear'}) ──") print(f"unique (single) cutters: {', '.join(unique_cutters(rec, enzymes)) or 'none'}") print("cutting enzymes (site count):") for e in sorted(cutting, key=lambda x: len(cutting[x])): print(f" {e:<10} {len(cutting[e])}x at {cutting[e]}") We build a linear plasmid map that represents the same annotated features along a base-pair axis for easier positional inspection. We then compute the cumulative GC-skew to observe directional nucleotide bias that can indicate replication-related structure. We also add sequence statistics and restriction-analysis utilities to summarize plasmid composition, enzyme cut sites, unique cutters, and expected digest fragments.
def virtual_gel(named_digests): lanes = [("Ladder", LADDER)] + list(named_digests.items()) fig, ax = plt.subplots(figsize=(1.4*len(lanes)+1, 6)) ax.set_facecolor("#0b1021") def y(sz): return math.log10(max(sz, 50)) for i, (name, frags) in enumerate(lanes): for f in frags: ax.hlines(y(f), i+0.62, i+1.38, color="#e6f1ff", lw=2 + min(4, f/1500), alpha=0.9) if name == "Ladder": ax.text(i+0.5, y(f), f"{f}", color="#9db4d0", ha="right", va="center", fontsize=7) ax.text(i+1, y(max(LADDER))+0.15, name, color="#e6f1ff", ha="center", fontsize=9, rotation=0) ax.set_xlim(0.2, len(lanes)+0.5); ax.set_ylim(y(80), y(12000)) ax.invert_yaxis(); ax.axis("off") ax.set_title("Virtual agarose gel", color="#333", fontsize=11) plt.tight_layout(); plt.show() def find_orfs(rec, min_aa=50): seq = rec.seq; L = len(seq); orfs = [] for strand, s in ((+1, seq), (-1, seq.reverse_complement())): s = str(s) for frame in range(3): i = frame while i < L - 2: if s[i:i+3] == "ATG": j = i while j < L - 2: if s[j:j+3] in ("TAA", "TAG", "TGA"): if (j - i)//3 >= min_aa: orfs.append((strand, frame, i, j+3, (j-i)//3)) i = j; break j += 3 i += 3 return sorted(orfs, key=lambda o: -o[4]) def translate_feature(rec, label): for f in rec.features: if label.lower() in label_of(f).lower() and f.type in ("CDS", "gene"): sub = f.location.extract(rec.seq) prot = sub.translate(table=11, to_stop=True) return str(prot) return None def _tm(primer): if _mt is not None: try: return float(_mt.Tm_NN(Seq(primer))) except Exception: pass p = primer.upper() return 2*(p.count("A")+p.count("T")) + 4*(p.count("G")+p.count("C")) def design_primers(rec, start, end, target_tm=60.0, lo=18, hi=30): seq = str(rec.seq) def tune(sub, rev=False): best = None for n in range(lo, hi+1): p = sub[-n:] if rev else sub[:n] if rev: p = str(Seq(p).reverse_complement()) score = abs(_tm(p) - target_tm) if best is None or score < best[0]: best = (score, p) return best[1] fwd = tune(seq[start:start+hi]) rev = tune(seq[end-hi:end], rev=True) print(f"── Primers to amplify {start}–{end} ({end-start} bp) ──") print(f" FWD 5'-{fwd}-3' len {len(fwd)} Tm {_tm(fwd):.1f}°C GC {gc_percent(fwd):.0f}%") print(f" REV 5'-{rev}-3' len {len(rev)} Tm {_tm(rev):.1f}°C GC {gc_percent(rev):.0f}%") print(f" amplicon: {end-start} bp") return fwd, rev We simulate a virtual agarose gel by plotting digest fragment sizes beside a DNA ladder on a log-scaled migration axis. We scan the plasmid sequence in all six reading frames to identify long open reading frames and rank them by amino-acid length. We also translate annotated CDS features and design primers around a selected region by tuning primer length toward a target melting temperature.
def edit_sequence(rec, pos, delete=0, insert=""): s = str(rec.seq) new = s[:pos] + insert + s[pos+delete:] out = SeqRecord(Seq(new), id=rec.id, name=rec.name + "_edit", description=rec.description + f" [edit @{pos}:-{delete}+{len(insert)}]") out.annotations = dict(rec.annotations) shift = len(insert) - delete for f in rec.features: s0, e0 = int(f.location.start), int(f.location.end) if s0 >= pos: s0 += shift if e0 > pos: e0 += shift if 0 <= s0 < e0 <= len(new): g = SeqFeature(FeatureLocation(s0, e0, strand=f.location.strand), type=f.type) g.qualifiers = dict(f.qualifiers); out.features.append(g) return out LIBRARY = {} def add_to_library(rec): LIBRARY[rec.name] = rec; print(f"+ added {rec.name} (now {len(LIBRARY)} in library)") def show_library(): for name, r in LIBRARY.items(): print(f" {name:<16} {len(r.seq):>7,} bp {gc_percent(r.seq):.1f}% GC") We implement a pure sequence-editing function that supports insertion, deletion, and replacement while returning a new edited SeqRecord. We preserve plasmid annotations and shift downstream feature coordinates so the edited construct remains internally consistent after sequence changes. We also create a lightweight in-notebook plasmid library that lets us store and list original and edited records during the workflow.
if __name__ == "__main__": rec = load_record() add_to_library(rec) print("n[1] Sequence statistics") stats(rec) print("n[2] Circular map (the signature SpliceCraft view)") circular_map(rec) print("n[3] Linear map + GC-skew") linear_map(rec) gc_skew_plot(rec) print("n[4] Restriction analysis") restriction_report(rec, enzymes=["EcoRI", "BamHI", "HindIII", "PstI", "SalI", "XbaI", "KpnI", "SacI", "SphI"]) print("n[5] Virtual digests on a gel") virtual_gel({ "EcoRI": digest_fragments(rec, ["EcoRI"]), "EcoRI+HindIII": digest_fragments(rec, ["EcoRI", "HindIII"]), "BamHI+SalI": digest_fragments(rec, ["BamHI", "SalI"]), }) print("n[6] Six-frame ORF scan (top 5 by length)") for strand, frame, s, e, aa in find_orfs(rec, min_aa=40)[:5]: print(f" strand {strand:+d} frame {frame} {s}-{e} {aa} aa") print("n[7] Translate a CDS feature") prot = translate_feature(rec, "AmpR") if prot: print(f" AmpR protein ({len(prot)} aa): {prot[:60]}...") print("n[8] Design primers to amplify a region") design_primers(rec, 400, 900) print("n[9] Edit the sequence (insert a 6-bp tag) and re-map") edited = edit_sequence(rec, pos=456, insert="CATCATCAT") add_to_library(edited) print("n[10] Library"); show_library() print("nDone. Call any function directly, e.g. circular_map(edited).") We run the full guided demo by loading a plasmid record, adding it to the library, and printing sequence statistics. We generate the circular map, linear map, GC-skew plot, restriction report, virtual gel, ORF scan, CDS translation, and primer design output in sequence. We finish by editing the plasmid, storing the edited construct, and showing how the notebook can act as a reusable plasmid workbench.
In conclusion, we completed the tutorial by turning a single notebook into a compact yet functional plasmid-engineering workspace. We moved from sequence loading and feature extraction to graphical plasmid visualization, GC-skew analysis, restriction mapping, gel simulation, ORF discovery, primer design, and editable sequence manipulation. By keeping each operation as a reusable Python function, we made the workflow modular enough to inspect real GenBank records, modify plasmid sequences, compare edited constructs, and extend the notebook with additional cloning or annotation utilities. Overall, we demonstrated how we can translate the behavior of a terminal plasmid tool into a reproducible, visual, and notebook-friendly bioinformatics workflow.
Check out the FULL CODES here. Also, feel free to follow us on Twitter and don’t forget to join our 150k+ML SubReddit and Subscribe to our Newsletter. Wait! are you on telegram? now you can join us on telegram as well.
Need to partner with us for promoting your GitHub Repo OR Hugging Face Page OR Product Release OR Webinar etc.? Connect with us
Sana Hassan
Sana Hassan, a consulting intern at Marktechpost and dual-degree student at IIT Madras, is passionate about applying technology and AI to address real-world challenges. With a keen interest in solving practical problems, he brings a fresh perspective to the intersection of AI and real-life solutions.